Reports
A report is a small source browser. Select Overview to find hot lines, Files to inspect the surrounding code, Functions to jump to definitions, and the notebook/Spark views for contextual information. Source snapshots remain available even after the original files change.
The report fits the browser window. When viewing a source file, its title, line count, and total time stay visible while the code table scrolls within the remaining space. Total time appears beside the line count and sums available line times for that file or notebook; sampling reports estimate these times. A dash means no line time is available. Column headings stay visible as you scroll, and long source lines scroll horizontally inside the same table.
Select a column heading in any report table to sort its rows, including Spark actions, operators, plan steps, and memory growth. The arrow to the right of the label shows the direction; select the same heading again to reverse it. Names sort alphabetically, line locations sort by position in the file, and measurements sort by their numeric values. Source sorts by line number, ascending by default, to restore original source order. Functions and Files start with the highest measured time, and source tables start in line order. Unknown measurements stay last in both directions; equal source measurements keep line order. All source lines and navigation links remain available in every order. Notebook tables sort lines within each cell, preserving cell boundaries and capture order.
The Heatmap by control sits on the right above each table. Functions and Files default to None; select Time to highlight expensive functions or files. Inside a source file or notebook, Time is the default, highlighting expensive lines. Select None to disable the heatmap. Source tables also offer Mem Growth when memory collection is enabled, coloring positive process-memory growth. Heatmap selection and row sorting are independent.
Source tables show Hits and Avg / hit when execution counts are available, and Samples when observation counts are available. Sampling backends omit the hit columns; tracing omits the sample column. Each source view includes the columns supported by its collectors, with unavailable values shown as dashes for cells collected by another backend. The Context column appears only when that source has Spark execution or child-notebook invocation links.
Index tables share the order Time, Location, Samples, Source when those fields apply. File and notebook indexes use Location for the snapshot name and retain Kind and Lines afterward. Functions use Source for the function name, include its definition's Location, and retain Lines. Traced functions use Calls in place of Samples. Full source and compact cell tables start with a narrow, unnamed line-number column, followed by Time and the other fields. They retain their additional hit, memory, GPU, and context columns, with Source last.
The line-number column has no sort control; use the Source header's arrows.
Time adds up time spent on the function's own lines, excluding time in other project functions it calls. Sampling reports estimate this time. Reports containing sampled child runs use Samples; functions without sampling counts show a dash.
Lines counts source lines from the def or async def statement through the
last statement in the body, including blank lines, comments, and nested
definitions. Decorators and trailing comments are excluded. The count includes
lines that were never executed or sampled; unavailable counts show a dash.
Files includes Python files and captured notebooks. When child notebook invocations are recorded, it also lists their parent wait times and status. Select an invocation to open its collection metadata and captured-source link. The Spark view and its overview count appear only when Spark executions were captured, including executions in child notebooks.
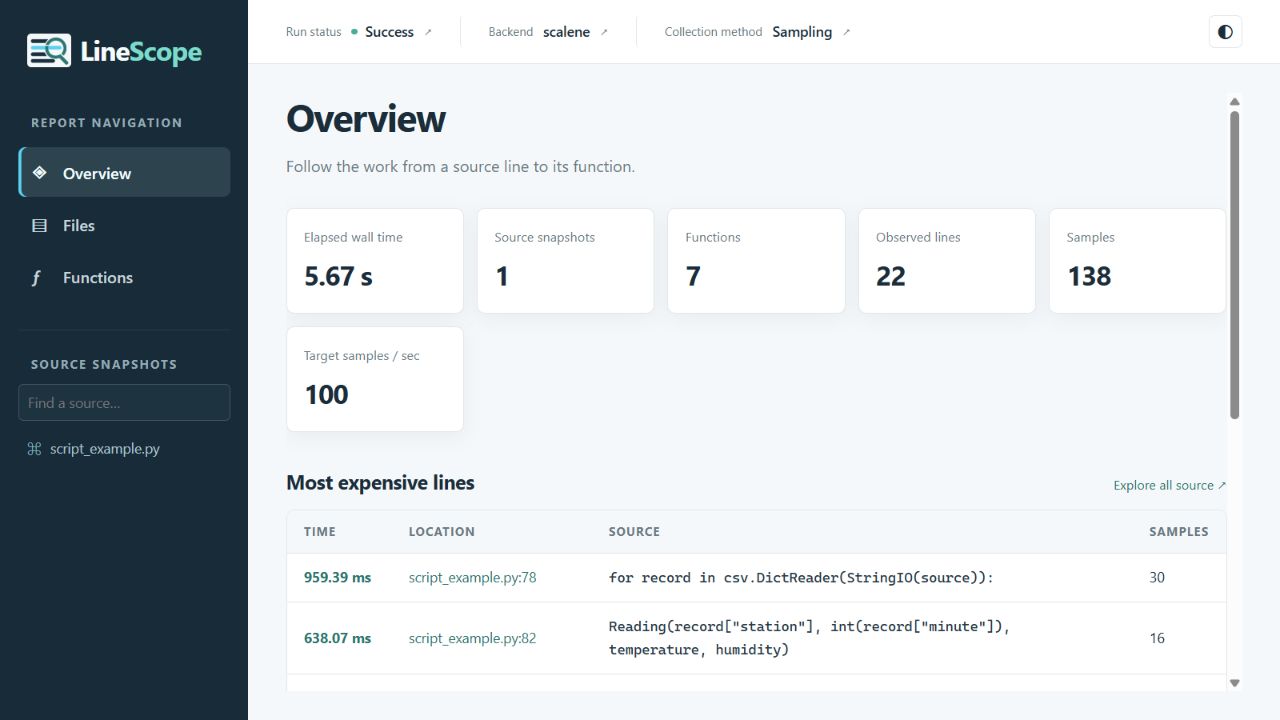
This example comes from the repository's examples/script_example.py. Times
depend on the machine, backend, and workload; the screenshot illustrates the
report rather than a benchmark.
The script processes four stations over 120 minutes so line-by-line memory collection stays practical. It includes complete 24-minute rolling windows and repeated temperature outliers in both implementations.
The main views
| View | Question it answers |
|---|---|
| Overview | Where should I start investigating? |
| Files | Which files, notebooks, and child invocations can I inspect? |
| Functions | Where is it defined, and what time was attributed to it? |
| Memory | When did process RAM grow, and which line was active? |
| GPU | Which source lines have sampled device work and GPU memory? |
| Spark | How does data flow, and which steps cost time or memory? |
GPU collection adds a GPU view with device cards and sortable line estimates, sampled memory peaks, driver time, and exact source links. Attributed GPU time sums available line estimates; it can overlap driver time and must remain separate from elapsed wall time. A dash means unavailable, including device memory on unsupported driver models.
Report header
The header separates the run outcome, the backend used, and its collection method. Select any of these labeled values to open the relevant user-guide section in a new tab. These help links require an internet connection; the report itself works offline.
Run status
Success means the run has no recorded failure. Failed means LineScope
recorded an error in the profiled run. A report can still contain useful
measurements from before the failure. Notebook entries marked Reference
represent inline execution that belongs to their parent run.
Backend collector
The backend names the collector that produced the measurements: trace,
scalene, tachyon, or a registered custom backend. Select its name to read
about that collector's capabilities and limitations in Backends.
Collection method
Tracing records Python execution events to measure line wall intervals and,
when supported, execution counts. Sampling estimates time from periodic
observations and cannot provide exact hit counts. Mixed collection means
the report combines runs whose collection capabilities differ.
This label describes how the measurements were collected. It does not indicate that profiling is still running. See backend performance for the effects of instrumentation on timings.
Profiling scope
The main run's backend determines which Python threads are observed. Built-in backends do not collect separate worker processes automatically. Child runs can use their own backend. See backend scope for thread coverage.
Elapsed wall time includes waits within the profiling session. It is not total CPU time across every worker. With Spark, the report separates driver action waiting from available cumulative executor/task metrics; these can overlap and must not be added together. Workers have no Python source-line or allocation measurements in the driver profile. See Spark worker scope for an example.
Line columns
| Column | Interpretation |
|---|---|
| Unnamed first column | One-based line number within the captured source |
| Time | Time attributed to the source line; estimated by sampling |
| Samples | Observed project thread frames, shown for sampling sources |
| Hits | Recorded executions when the backend supports them |
| Avg / hit | Time divided by hits, only when both are available |
| Mem Change | Accumulated process-memory change during this line's intervals |
| Peak Mem | Highest observed process memory during this line |
| GPU time | Sampled device work, separate from driver wall time |
| GPU peak memory | Highest sampled device-memory value for the line |
| Spark | Separate navigation references to observed executions |
| Source | Complete captured source text for this line |
Heat intensity uses a logarithmic scale relative to the report's largest visible value for the selected metric. This keeps smaller hotspots visible when one line dominates, using the same scale across source files. Time heat leaves unmeasured and zero-time lines uncolored. Mem Growth heat colors only positive accumulated changes; decreases, zeroes, and unavailable readings have no heat. Switching heatmaps preserves the measurements and current line order. A dash means unavailable or unmeasured; sampled zeroes do not prove that a line took no time. Source backgrounds, syntax colors, and links follow the report's light or dark theme, including the system preference.
The backend determines which columns can contain measurements.
With memory=True, source tables show Mem Change and Peak Mem for the profiled
Python process. Retained Python allocation changes remain in the collected
profile data; the source table displays only process-memory measurements.
Byte measurements use decimal units: 1 KB is 1,000 bytes, 1 MB is 1,000,000
bytes, and 1 GB is 1,000,000,000 bytes.
With memory=True, the Memory view starts with badges for the highest observed
process RAM and the largest accumulated change on one source line. These
badges precede the RAM timeline. The peak badge displays only the RAM value;
the largest line change links to its source when available. Chart timestamps
show elapsed time since profiling started. A reading without a linked project
line has no link to snapshotted source. This can happen at
the start or end of profiling, or while no project line is active; it does not
identify the code that allocated the RAM. RAM used by this process is physical
memory held by Python, its libraries, and the profiler, also called resident
memory or RSS. Hover over the memory plot to show a gray vertical guide, the
exact elapsed time and byte count, and a source link when available. Missing
readings stay unavailable. Focus the plot and use the arrow keys to inspect
readings, or press Enter to open linked source. Below the chart, inspect the
growth ranking to identify lines that accumulate RAM across loop iterations.
Its Location column links to the captured file or notebook cell and line; the
Source column shows the code on that line. Memory values use compact columns,
and location and source stay on one line, with horizontal scrolling when
needed. Separate child processes keep their own badges and timelines. See
memory for the measurement definitions, scope, overhead,
and observed-peak limitations.
Sampling reports include Samples in the hot-line, source, Functions, and Files tables, plus a total sample count and the main run's measured samples per second. The measured rate divides that run's observed samples by its elapsed wall time; child-process samples do not contribute to this rate. Unknown counts or zero elapsed time leave the rate unavailable. Function counts sum the observations of their own lines, excluding nested definitions. File and notebook counts sum their captured line counts. Child runs retain their own sampling settings in their invocation details.
Samples are observations, not execution hits or function calls. Scalene can observe several project threads in one sampling pass; each accepted thread frame contributes one sample to its nearest project line. Its time estimates may redistribute cost across nearby lines, so counts cannot be reconstructed from time. An unsampled line has zero observations when the collector supplies sample counts; unavailable counts remain a dash. Configure the target rate as described in Sampling rate.
Source snapshots
Project discovery uses the configured root, nearby project metadata, and explicit include/exclude rules. Installed third-party libraries, interpreter internals, and unrelated files remain outside the source browser. Their work can still contribute to the calling project's measured time.
Source is stored with the profile result, including notebook cells. Editing or
deleting the original file later does not change the saved report. A source unit
has an identifier, original path, text, and kind (python or notebook).
Python source titles and file lists show only the filename. Files with the same name keep distinct navigation targets through their original source identities.
Each notebook has one entry in Source snapshots and Files. Its source view stacks all captured cells in capture order, with a labeled boundary before each cell. Line numbers restart at one in every cell. Sorting applies within each cell, retaining capture order. Overview counts treat a notebook as one source; its line counts and measurements combine its captured cells. Function, Spark, and memory links still target the exact cell and line. If a cell changes during collection, both snapshots remain visible with revision labels. Uncaptured cells are not reconstructed. The current cell's label stays visible beneath the column headings while scrolling.
See configuration for scope controls.
Source navigation
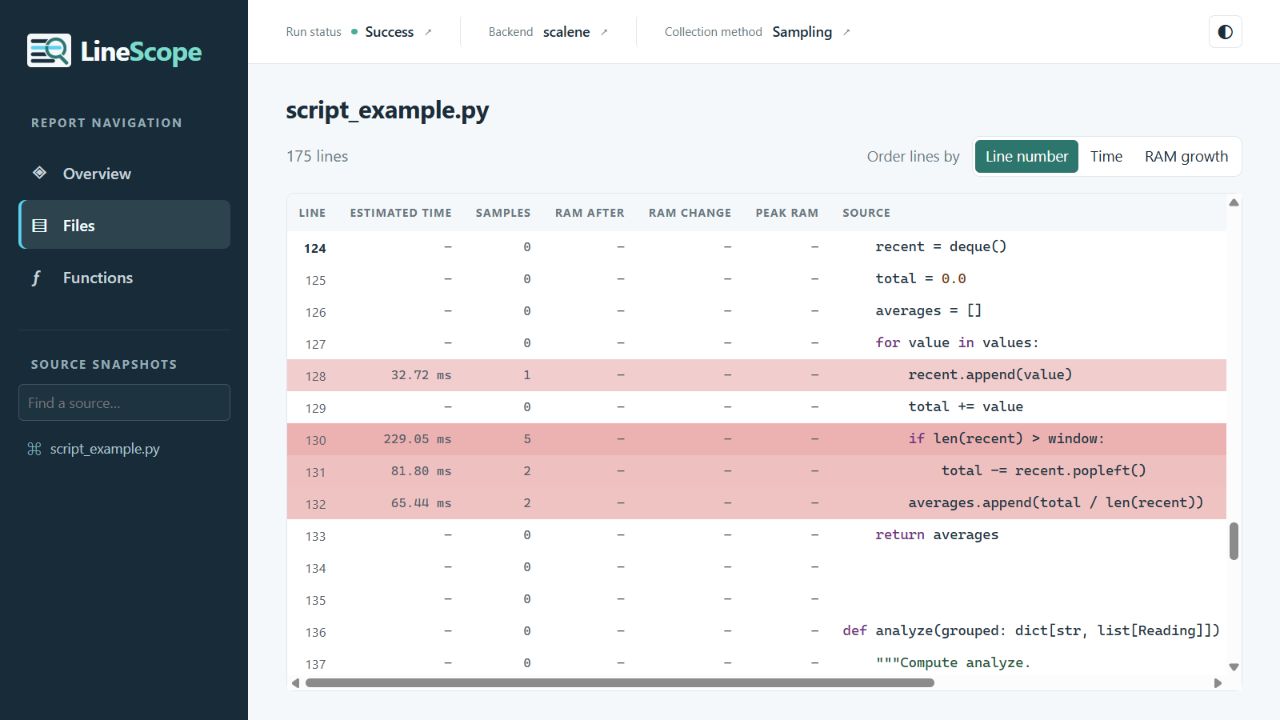
Function and class links target their definitions. Each call is linked
separately, so outer(inner(value)) can have two links. An unresolved or
third-party call remains unlinked. Spark badges are separate from symbol links.
Notebook paths can point to captured notebook source or child-run metadata.
Linked symbols are colored and underlined. Selecting a link places its definition immediately below the source table's column and cell headings, including definitions near the end of a file.
Static analysis builds an index of project functions, classes, methods, imports, and call sites. The renderer links individual symbol spans. Multiple calls on one line remain separate targets. Known local class instances can resolve methods; dynamic dispatch, runtime imports, and ambiguous names may remain unlinked. An absent link is preferable to a misleading destination.
Includes and excludes are scope controls, not a mechanism for obtaining private code from inaccessible locations. Notebook references use captured or explicitly registered source.
The report uses hash navigation, line links, and browser back/forward controls. It does not fetch source from a server.
Saving and sharing
Call session.save("report.html") to write a self-contained HTML report. The
file embeds its source and assets and works offline without the original project
files or a running server.
Review the embedded source, paths, and integration metadata before sharing outside your project, especially notebook cells containing inline credentials or private paths. Escaping prevents source text from becoming executable HTML; it does not remove sensitive source.