Reports
Open Overview to find expensive lines, then follow a source link.
Source excerpts show the complete statement with its original line breaks and
relative indentation. The entire location label, such as
script_example.py:83-86, links to line 83, even when the measurement came
from a continuation line. Each measurement describes the line where it was
collected.
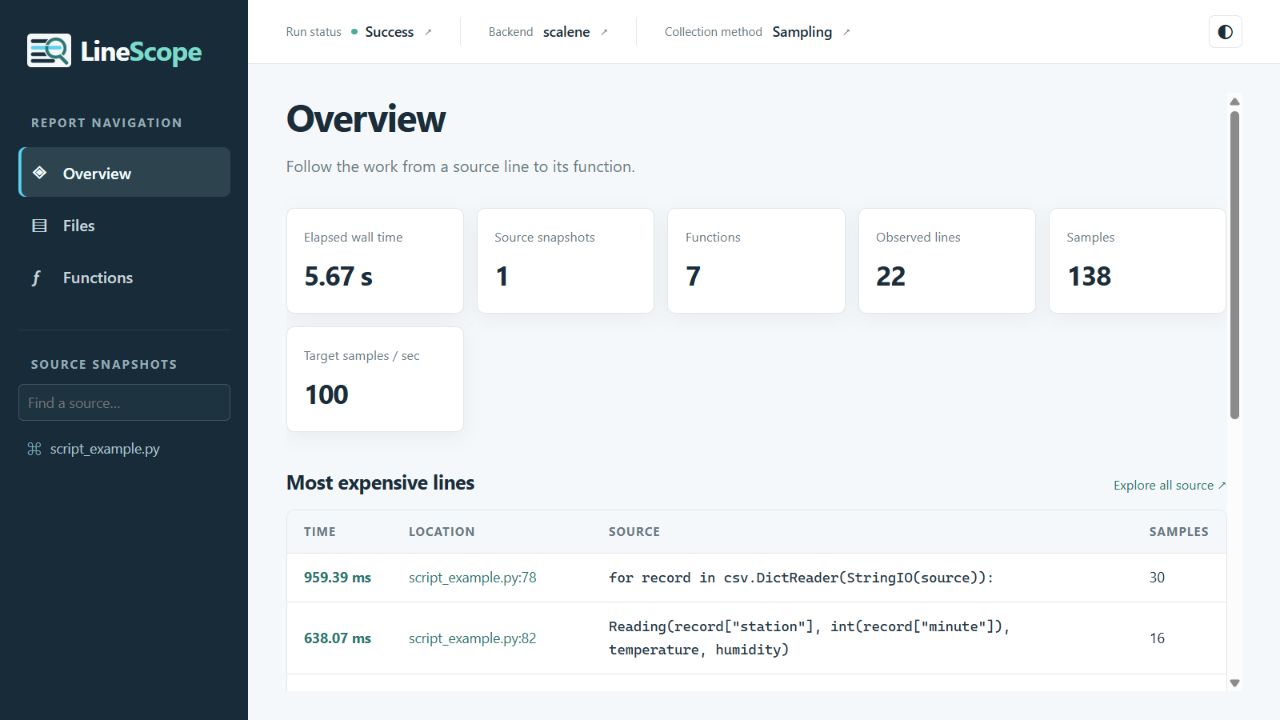
Views
| View | Contents |
|---|---|
| Overview | Most expensive lines |
| Files | Files and notebook cells |
| Functions | Function totals, calls, and averages |
| Memory | Process RAM growth and timeline |
| GPU | Sampled device time and memory |
| Spark | Actions, query plans, and operator costs |
Memory, GPU, and Spark appear when their data is available. Select a column heading to sort; select it again to reverse. Source restores line order. Heatmap by highlights time or positive memory growth.
AI suggestions
Use the AI button in the report header to connect a model. Once connected, you can request suggestions for source lines and individual Spark actions. See AI suggestions for setup and context options.
Report header
Run status
Failed keeps measurements collected before the error. Reference notebook entries belong to their parent run.
Backend collector
The selected collector: Trace, Scalene, Tachyon, or a custom one.
Collection method
Tracing records events; Sampling estimates time from observations. Mixed collection combines collectors.
Line columns
| Column | Meaning |
|---|---|
| Time | Attributed line time; estimated with sampling |
| Samples | Observations, not execution counts |
| Hits | Recorded executions |
| Avg / hit | Time divided by hits |
| Mem Change | Accumulated process RAM change during the line |
| Peak Mem | Highest observed process RAM during the line |
| GPU time | Estimated device work |
| GPU peak memory | Highest sampled device memory |
| Context | Spark actions or child notebooks |
| Source | Captured code |
A dash means unavailable. Zero samples do not prove a line never ran.
In Functions, Time totals a function's own lines across all calls, excluding other project functions it calls. Avg / call divides Time by Calls. If profiling starts inside a function, its time is kept but Calls and Avg / call are unavailable because its entry was missed.
Profiling scope
Elapsed time includes waits, not summed worker CPU time. Thread coverage depends on the backend. See Spark scope for distributed workloads and memory for RAM limits.
Source snapshots
Reports contain the code that ran. Notebook cells retain their numbers and executed versions; line numbering restarts in each cell. Library costs are attributed to the calling project line.
Source navigation
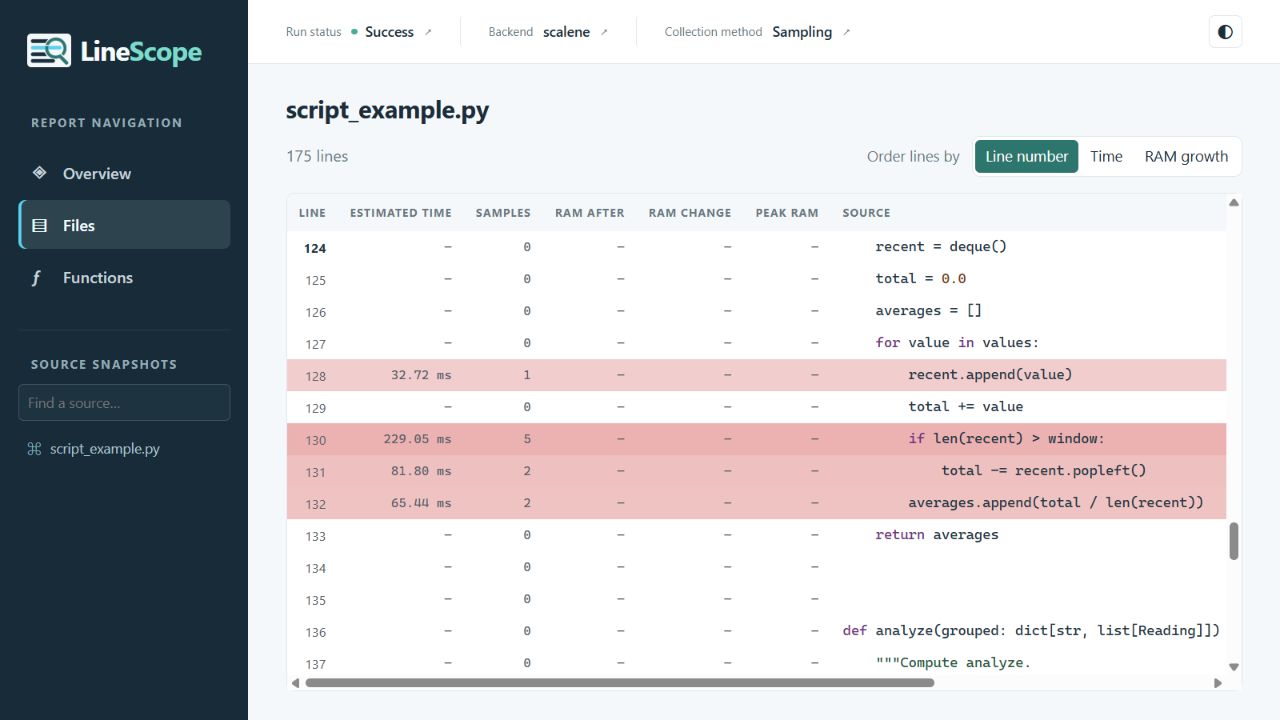
Select an underlined name to open its definition. Ambiguous definitions and third-party calls stay unlinked. Browser back and forward retrace navigation.
Saving and sharing
session.save("report.html") writes a self-contained report that works offline.
Review its source, paths, and metadata before sharing.